
 免费 AI IDE

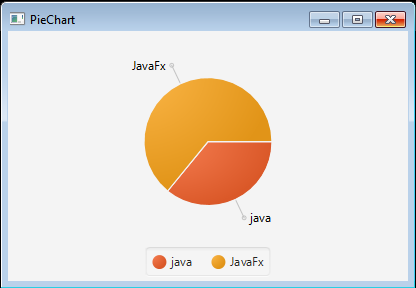
JavaFX 饼图
2019-04-17 11:24 更新
JavaFX教程 - JavaFX饼图
表示圆圈中的数据的图表,每个切片表示百分比。
import javafx.application.Application;
import javafx.collections.FXCollections;
import javafx.collections.ObservableList;
import javafx.scene.Scene;
import javafx.scene.chart.PieChart;
import javafx.scene.chart.PieChart.Data;
import javafx.scene.layout.StackPane;
import javafx.stage.Stage;

public class Main extends Application {

    public static void main(String[] args) {
        launch(args);
    }

    @Override
    public void start(Stage primaryStage) {
        PieChart pieChart = new PieChart();
        pieChart.setData(getChartData());
        primaryStage.setTitle("PieChart");

        StackPane root = new StackPane();
        root.getChildren().add(pieChart);
        primaryStage.setScene(new Scene(root, 400, 250));
        primaryStage.show();
    }

    private ObservableList<Data> getChartData() {
        ObservableList<Data> answer = FXCollections.observableArrayList();
        answer.addAll(new PieChart.Data("java", 17.56),
                new PieChart.Data("JavaFx", 31.37));
        return answer;
    }
}
上面的代码生成以下结果。
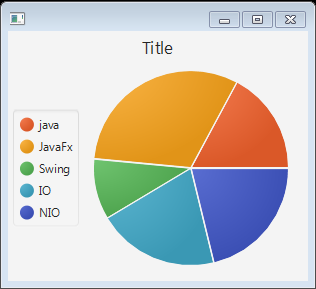
创建饼图
要创建饼图,我们需要PieChart类。
饼图数据包裹在PieChart.Data对象中。
每个PieChart.Data对象有两个字段:饼图扇区的名称及其对应的值。
import javafx.application.Application;
import javafx.collections.FXCollections;
import javafx.collections.ObservableList;
import javafx.geometry.Side;
import javafx.scene.Scene;
import javafx.scene.chart.PieChart;
import javafx.scene.chart.PieChart.Data;
import javafx.scene.layout.StackPane;
import javafx.stage.Stage;

public class Main extends Application {
  public static void main(String[] args) {
    launch(args);
  }
  @Override
  public void start(Stage primaryStage) {
    PieChart pieChart = new PieChart();
    pieChart.setData(getChartData());
    pieChart.setTitle("Title");
    pieChart.setLegendSide(Side.LEFT);
    pieChart.setClockwise(false);
    pieChart.setLabelsVisible(false);

    StackPane root = new StackPane();
    root.getChildren().add(pieChart);
    primaryStage.setScene(new Scene(root, 300, 250));
    primaryStage.show();
  }

  private ObservableList<Data> getChartData() {
    ObservableList<Data> answer = FXCollections.observableArrayList();
    answer.addAll(new PieChart.Data("java", 17),
            new PieChart.Data("JavaFx",31),
            new PieChart.Data("Swing",10),
            new PieChart.Data("IO",20),
            new PieChart.Data("NIO",21)
            );
    return answer;
  }


}
上面的代码生成以下结果。
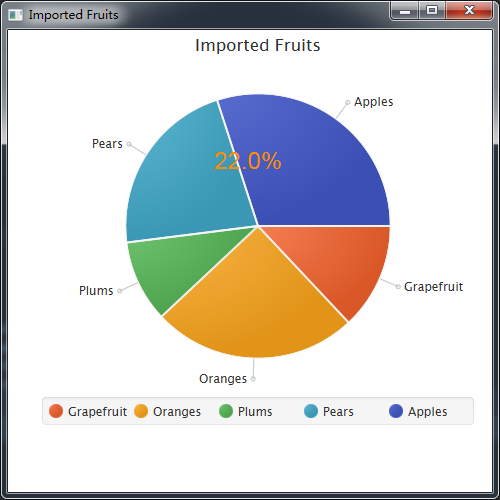
处理饼图的事件
以下代码创建一个EventHandler对象来处理落入特定图表切片的MOUSE_PRESSED事件。
/*
 * Copyright (c) 2011, 2012 Oracle and/or its affiliates.
 * All rights reserved. Use is subject to license terms.
 *
 * This file is available and licensed under the following license:
 *
 * Redistribution and use in source and binary forms, with or without
 * modification, are permitted provided that the following conditions
 * are met:
 *
 *  - Redistributions of source code must retain the above copyright
 *    notice, this list of conditions and the following disclaimer.
 *  - Redistributions in binary form must reproduce the above copyright
 *    notice, this list of conditions and the following disclaimer in
 *    the documentation and/or other materials provided with the distribution.
 *  - Neither the name of Oracle nor the names of its
 *    contributors may be used to endorse or promote products derived
 *    from this software without specific prior written permission.
 *
 * THIS SOFTWARE IS PROVIDED BY THE COPYRIGHT HOLDERS AND CONTRIBUTORS
 * "AS IS" AND ANY EXPRESS OR IMPLIED WARRANTIES, INCLUDING, BUT NOT
 * LIMITED TO, THE IMPLIED WARRANTIES OF MERCHANTABILITY AND FITNESS FOR
 * A PARTICULAR PURPOSE ARE DISCLAIMED. IN NO EVENT SHALL THE COPYRIGHT
 * OWNER OR CONTRIBUTORS BE LIABLE FOR ANY DIRECT, INDIRECT, INCIDENTAL,
 * SPECIAL, EXEMPLARY, OR CONSEQUENTIAL DAMAGES (INCLUDING, BUT NOT
 * LIMITED TO, PROCUREMENT OF SUBSTITUTE GOODS OR SERVICES; LOSS OF USE,
 * DATA, OR PROFITS; OR BUSINESS INTERRUPTION) HOWEVER CAUSED AND ON ANY
 * THEORY OF LIABILITY, WHETHER IN CONTRACT, STRICT LIABILITY, OR TORT
 * (INCLUDING NEGLIGENCE OR OTHERWISE) ARISING IN ANY WAY OUT OF THE USE
 * OF THIS SOFTWARE, EVEN IF ADVISED OF THE POSSIBILITY OF SUCH DAMAGE.
 */

//package piechartsample;

import javafx.application.Application;
import javafx.collections.FXCollections;
import javafx.collections.ObservableList;
import javafx.event.EventHandler;
import javafx.scene.Scene;
import javafx.scene.paint.Color;
import javafx.stage.Stage;
import javafx.scene.chart.*;
import javafx.scene.Group;
import javafx.scene.control.Label;
import javafx.scene.input.MouseEvent;

public class Main extends Application {

    @Override
    public void start(Stage stage) {
        Scene scene = new Scene(new Group());
        stage.setTitle("Imported Fruits");
        stage.setWidth(500);
        stage.setHeight(500);

        ObservableList<PieChart.Data> pieChartData =
                FXCollections.observableArrayList(
                new PieChart.Data("Grapefruit", 13),
                new PieChart.Data("Oranges", 25),
                new PieChart.Data("Plums", 10),
                new PieChart.Data("Pears", 22),
                new PieChart.Data("Apples", 30));

        final PieChart chart = new PieChart(pieChartData);
        chart.setTitle("Imported Fruits");
        final Label caption = new Label("");
        caption.setTextFill(Color.DARKORANGE);
        caption.setStyle("-fx-font: 24 arial;");

        for (final PieChart.Data data : chart.getData()) {
            data.getNode().addEventHandler(MouseEvent.MOUSE_PRESSED,
                    new EventHandler<MouseEvent>() {
                        @Override public void handle(MouseEvent e) {
                            caption.setTranslateX(e.getSceneX());
                            caption.setTranslateY(e.getSceneY());
                            caption.setText(String.valueOf(data.getPieValue())
                                + "%");
                        }
                    });
        }

        ((Group) scene.getRoot()).getChildren().addAll(chart, caption);
        stage.setScene(scene);
        //scene.getStylesheets().add("piechartsample/Chart.css");
        stage.show();
    }

    public static void main(String[] args) {
        launch(args);
    }
}
上面的代码生成以下结果。
以上内容是否对您有帮助:


更多建议: