

背景需求
使用 D3 绘制图表一般都会绘制一个坐标轴,但是用 D3 画过图的同学都知道默许情况下绘制的坐标轴刻度是英文的。但是我们要的刻度是中文的。怎样办呢?且看本文讲授如何绘制本地时间轴。
绘制效果
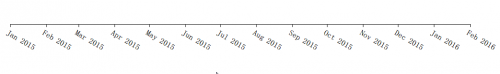
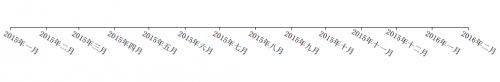
实现效果如何?先来一睹为快!
默认格式化:
d3.time.format("%b %Y")
本地格式化:
zh.timeFormat("%Y年%b")
实现思路
思路很简单:
定义简体中文本地化
用本地时间格式化函数格式化数轴的刻度值
关键技术
定义新的简体中文本地化
//简体中文本地化
var zh = d3.locale({ decimal: ".", thousands: ",", grouping: [3], currency: ["¥", ""],
dateTime: "%a %b %e %X %Y",
date: "%Y/%-m/%-d", time: "%H:%M:%S", periods: ["上午", "下午"],
days: ["星期日", "星期1", "星期2", "星期3", "星期4", "星期5", "星期6"],
shortDays: ["星期日", "星期1", "星期2", "星期3", "星期4", "星期5", "星期6"],
months: ["1月", "2月", "3月", "4月", "5月", "6月", "7月", "8月", "9月", "10月", "101月", "102月"],
shortMonths: ["1月", "2月", "3月", "4月", "5月", "6月", "7月", "8月", "9月", "10月", "101月", "102月"] });
定义时间比例尺
//时间比例尺 var timeScale = d3.time.scale() .domain([new Date(2015, 0, 1), new Date(2016, 1, 1)]) .range([0, width-40]);
指定轴的比例尺和格式化函数
//时间轴 var axis = d3.svg.axis() .scale(timeScale) .tickFormat(zh.timeFormat("%Y年%b"))//指定为本地格式化函数 .orient("bottom")
绘制数轴
//添加时间轴 var svg = d3.select("body").append("svg") .attr("width", width+200) .attr("height", height) .append("g") .attr("class", "axis") .attr("transform", "translate(" + 20 + "," + height/2 + ")") .call(axis);
调剂刻度样式
//旋转文字 d3.selectAll(g.tick text).attr(transform,translate(30,20)rotate(30))
本例很简单,可使用下面的代码测试效果,你学会了吗?
完全代码
<meta charset="utf⑻">
<style> body{ font-weight:bold; }
.axis path,
.axis line { fill: none; stroke: #000; shape-rendering: crispEdges; }
</style>
<body>
<script src="../../d3.js"> <script>
//简体中文本地化
var zh = d3.locale({ decimal: ".", thousands: ",", grouping: [3], currency: ["¥", ""],
dateTime: "%a %b %e %X %Y", date: "%Y/%-m/%-d",
time: "%H:%M:%S",
periods: ["上午", "下午"],
days: ["星期日", "星期1", "星期2", "星期3", "星期4", "星期5", "星期6"],
shortDays: ["星期日", "星期1", "星期2", "星期3", "星期4", "星期5", "星期6"],
months: ["1月", "2月", "3月", "4月", "5月", "6月", "7月", "8月", "9月", "10月", "101月", "102月"],
shortMonths: ["1月", "2月", "3月", "4月", "5月", "6月", "7月", "8月", "9月", "10月", "101月", "102月"] });
//svg宽,高
var width = 1000,height = 500;
//时间比例尺
var timeScale = d3.time.scale() .domain([new Date(2015, 0, 1), new Date(2016, 1, 1)]) .range([0, width-40]);
//时间轴
var axis = d3.svg.axis() .scale(timeScale) .tickFormat(zh.timeFormat("%Y年%b")) .orient("bottom")
//添加时间轴
var svg = d3.select("body").append("svg") .attr("width", width+200) .attr("height", height) .append("g") .attr("class", "axis") .attr("transform", "translate(" + 20 + "," + height/2 + ")") .call(axis);
//旋转文字
d3.selectAll(g.tick text).attr(transform,translate(30,20)rotate(30)) script>
可以查看更多JavaScript实例