
 免费 AI IDE

创建3D直方图
2018-10-28 11:11 更新
目标
在本教程中,您将学习如何
- 为viz窗口创建自己的回调键盘功能。
- 在viz窗口中显示3D直方图。
Code
你可以从这里下载代码。
#include <opencv2/opencv.hpp>
#include <iostream>
using namespace std;
using namespace cv;
#ifdef HAVE_OPENCV_VIZ
const String keys =
"{Aide h usage ? help  |     | print this message   }"
"{@arg1                |     | Full path to color imag (3 channels)}"
;
struct Histo3DData {
    Mat histogram;
    int seuil;
    double threshold;
    Ptr<viz::Viz3d> fen3D;
    int nbWidget;
    bool status;
    double maxH;
    int code;
};
void DrawHistogram3D(Histo3DData &);
void AddSlidebar(String sliderName, String windowName, int sliderMin, int sliderMax, int valeurDefaut, int *sliderVal, void(*f)(int, void *), void *r);
void UpdateThreshold(int , void * r);
void  KeyboardViz3d(const viz::KeyboardEvent &w, void *t);
void DrawHistogram3D(Histo3DData &h)
{
    int planSize = h.histogram.step1(0);
    int cols = h.histogram.step1(1);
    int rows = planSize / cols;
    int plans = h.histogram.total() / planSize;
    h.fen3D->removeAllWidgets();
    h.nbWidget=0;
    if (h.nbWidget==0)
        h.fen3D->showWidget("Axis", viz::WCoordinateSystem(10));
    for (int k = 0; k < plans; k++)
    {
        for (int i = 0; i < rows; i++)
        {
            for (int j = 0; j < cols; j++)
            {
                double x = h.histogram.at<float>(k, i, j);
                if (x >= h.threshold)
                {
                    double r=std::max(x/h.maxH,0.1);
                    viz::WCube s(Point3d(k - r / 2, i - r / 2, j - r / 2), Point3d(k + r / 2, i + r / 2, j + r / 2), false, viz::Color(j / double(plans) * 255, i / double(rows) * 255, k / double(cols) * 255));
                    h.fen3D->showWidget(format("I3d%d", h.nbWidget++), s);
                }
            }
        }
    }
    h.status = false;
}
void  KeyboardViz3d(const viz::KeyboardEvent &w, void *t)
{
   Histo3DData *x=(Histo3DData *)t;
   if (w.action)
       cout << "you pressed "<< w.symbol<< " in viz window "<<x->fen3D->getWindowName()<<"\n";
   x->code= w.code;
   switch (w.code) {
   case '/':
           x->status=true;
           x->threshold *= 0.9;
       break;
   case '*':
       x->status = true;
           x->threshold *= 1.1;
       break;
    }
   if (x->status)
   {
       cout <<  x->threshold << "\n";
       DrawHistogram3D(*x);
   }
}
void AddSlidebar(String sliderName, String windowName, int sliderMin, int sliderMax, int defaultSlider, int *sliderVal, void(*f)(int, void *), void *r)
{
    createTrackbar(sliderName, windowName, sliderVal, 1, f, r);
    setTrackbarMin(sliderName, windowName, sliderMin);
    setTrackbarMax(sliderName, windowName, sliderMax);
    setTrackbarPos(sliderName, windowName, defaultSlider);
}
void UpdateThreshold(int , void * r)
{
    Histo3DData *h = (Histo3DData *)r;
    h->status=true;
    h->threshold = h->seuil/1000000.0;
    cout<<"Widget : "<<h->nbWidget<<","<< h->threshold<<"\n";
}
int main (int argc,char **argv)
{
    CommandLineParser parser(argc, argv, keys);
    if (parser.has("help"))
    {
        parser.printMessage();
        return 0;
    }
    String nomFic = parser.get<String>(0);
    Mat img;
    if (nomFic.length() != 0)
    {
        img = imread(nomFic, IMREAD_COLOR);
        if (img.empty())
        {
            cout << "Image does not exist!";
            return 0;
        }
    }
    else
    {
        img = Mat(512,512,CV_8UC3);
        parser.printMessage();
        RNG r;
        r.fill(img(Rect(0, 0, 256, 256)), RNG::NORMAL, Vec3b(60, 40, 50), Vec3b(10, 5, 20));
        r.fill(img(Rect(256, 0, 256, 256)), RNG::NORMAL, Vec3b(160, 10, 50), Vec3b(20, 5, 10));
        r.fill(img(Rect(0, 256, 256, 256)), RNG::NORMAL, Vec3b(90, 100, 50), Vec3b(10, 20, 20));
        r.fill(img(Rect(256, 256, 256, 256)), RNG::NORMAL, Vec3b(100, 10, 150), Vec3b(10, 5, 40));
    }
    Histo3DData h;
    h.status=true;
    h.seuil=90;
    h.threshold= h.seuil/1000000.0;
    float hRange[] = { 0, 256 };
    const float* etendu[] = { hRange, hRange,hRange };
    int hBins = 32;
    int histSize[] = { hBins, hBins , hBins  };
    int channel[] = { 2, 1,0 };
    calcHist(&img, 1, channel, Mat(), h.histogram, 3, histSize, etendu, true, false);
    normalize(h.histogram, h.histogram, 100.0/(img.total()), 0, NORM_MINMAX, -1, Mat());
    minMaxIdx(h.histogram,NULL,&h.maxH,NULL,NULL);
    namedWindow("Image");
    imshow("Image",img);
    AddSlidebar("threshold","Image",0,100,h.seuil,&h.seuil, UpdateThreshold,&h);
    waitKey(30);
    h.fen3D = new viz::Viz3d("3D Histogram");
    h.nbWidget=0;
    h.fen3D->registerKeyboardCallback(KeyboardViz3d,&h);
    DrawHistogram3D(h);
    while (h.code!=27)
    {
        h.fen3D->spinOnce(1);
        if (h.status)
            DrawHistogram3D(h);
        if (h.code!=27)
            h.code= waitKey(30);
    }
    return 0;
}
#else
int main(int argc, char **argv)
{
cout << " you need VIZ module\n";
return 0;
}
#endif
说明
这是程序的一般结构:
- 您可以在命令行中给图像的完整路径
    CommandLineParser parser(argc, argv, keys);
    if (parser.has("help"))
    {
        parser.printMessage();
        return 0;
    }
    String nomFic = parser.get<String>(0);
    Mat img;
    if (nomFic.length() != 0)
    {
        img = imread(nomFic, IMREAD_COLOR);
        if (img.empty())
        {
            cout << "Image does not exist!";
            return 0;
        }
}或没有路径,生成合成图像,其中像素值是第一象限中的高斯分布cv :: RNG ::填充中心(60 +/- 10,40 +/- 5,50 +/- 20),(160+ / -20,10 +/- 5,50 +/- 10),第三象限(90 +/- 10,100 +/- 20,50 +/- 20),(100 +/- 10,10+ / -5,150 +/- 40)。
    else
    {
        img = Mat(512,512,CV_8UC3);
        parser.printMessage();
        RNG r;
        r.fill(img(Rect(0, 0, 256, 256)), RNG::NORMAL, Vec3b(60, 40, 50), Vec3b(10, 5, 20));
        r.fill(img(Rect(256, 0, 256, 256)), RNG::NORMAL, Vec3b(160, 10, 50), Vec3b(20, 5, 10));
        r.fill(img(Rect(0, 256, 256, 256)), RNG::NORMAL, Vec3b(90, 100, 50), Vec3b(10, 20, 20));
        r.fill(img(Rect(256, 256, 256, 256)), RNG::NORMAL, Vec3b(100, 10, 150), Vec3b(10, 5, 40));
    }
图像立体直方图使用opencv cv :: calcHist和cv :: normalize在0和100之间计算。
    Histo3DData h
    h.status = true ;
    h.seuil = 90;
    h.threshold = h.seuil / 1000000.0;
    float hRange [] = {0,256};
    const  float * etendu [] = {hRange,hRange,hRange};
    int hBins = 32;
    int histSize [] = {hBins,hBins,hBins};
    int channel [] = {2,1,0};
    calcHist(&img,1,channel,Mat(),h.histogram,3,histSize,etendu,true,false);
    归一化(h.histogram,h.histogram,100.0 /(img.total()),0,NORM_MINMAX,-1,Mat());
    minMaxIdx(h.histogram,NULL,&h.maxH,NULL,NULL);
通道是2,1和0,可以在objetc cv :: viz :: WCoordinateSystem中同步颜色与Viz轴颜色。
在图像窗口中插入滑块。初始化滑块值为90,表示只显示大于9 / 100000.0的直方图单元(512×512像素的23像素)。
    namedWindow(“Image”);
    imshow(“Image”,img);
    AddSlidebar(“threshold”,“Image”,0,100,h.seuil,&h.seuil,UpdateThreshold,&h);
waitKey(30);我们准备打开一个带有回调函数的窗口,以捕获viz窗口中的键盘事件。使用cv :: viz :: Viz3d :: spinOnce启用键盘事件在cv :: imshow窗口中捕获。
    h.fen3D = new viz::Viz3d("3D Histogram");
    h.nbWidget=0;
    h.fen3D->registerKeyboardCallback(KeyboardViz3d,&h);
    DrawHistogram3D(h);
    while (h.code!=27)
    {
        h.fen3D->spinOnce(1);
        if (h.status)
            DrawHistogram3D(h);
        if (h.code!=27)
            h.code= waitKey(30);
}DrawHistogram3D函数处理直方图Mat以在Viz窗口中显示它。可以使用以下代码找到三维Mat中的计划,行和列数:
    int planSize = h.histogram.step1(0);
    int cols = h.histogram.step1(1);
    int rows = planSize / cols;
    int plans = h.histogram.total() / planSize;
    h.fen3D->removeAllWidgets();
    h.nbWidget=0;
    if (h.nbWidget==0)
h.fen3D->showWidget("Axis", viz::WCoordinateSystem(10));要在特定位置获取直方图值,我们使用三个参数k,i和j的cv :: Mat :: at(int i0,int i1,int i2)方法,其中k是平面数,i行号和j列数。
    for (int k = 0; k < plans; k++)
    {
        for (int i = 0; i < rows; i++)
        {
            for (int j = 0; j < cols; j++)
            {
                double x = h.histogram.at<float>(k, i, j);
                if (x >= h.threshold)
                {
                    double r=std::max(x/h.maxH,0.1);
                    viz::WCube s(Point3d(k - r / 2, i - r / 2, j - r / 2), Point3d(k + r / 2, i + r / 2, j + r / 2), false, viz::Color(j / double(plans) * 255, i / double(rows) * 255, k / double(cols) * 255));
                    h.fen3D->showWidget(format("I3d%d", h.nbWidget++), s);
                }
            }
        }
}- 回调函数原理是作为鼠标回调函数。按键代码是cv :: viz :: KeyboardEvent类的字段代码。
void  KeyboardViz3d(const viz::KeyboardEvent &w, void *t)
{
   Histo3DData *x=(Histo3DData *)t;
   if (w.action)
       cout << "you pressed "<< w.symbol<< " in viz window "<<x->fen3D->getWindowName()<<"\n";
   x->code= w.code;
   switch (w.code) {
   case '/':
           x->status=true;
           x->threshold *= 0.9;
       break;
   case '*':
       x->status = true;
           x->threshold *= 1.1;
       break;
    }
   if (x->status)
   {
       cout <<  x->threshold << "\n";
       DrawHistogram3D(*x);
   }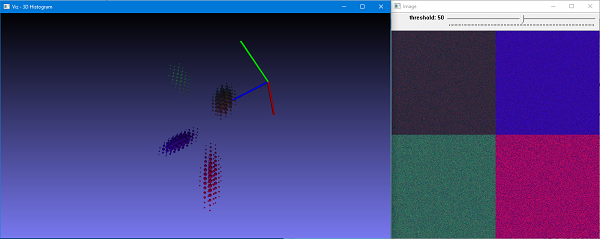
}- 结果
这里是没有参数和阈值等于50的程序的结果。
以上内容是否对您有帮助:


更多建议: