
Example: Plotting Validation Curves
Plotting Validation Curves
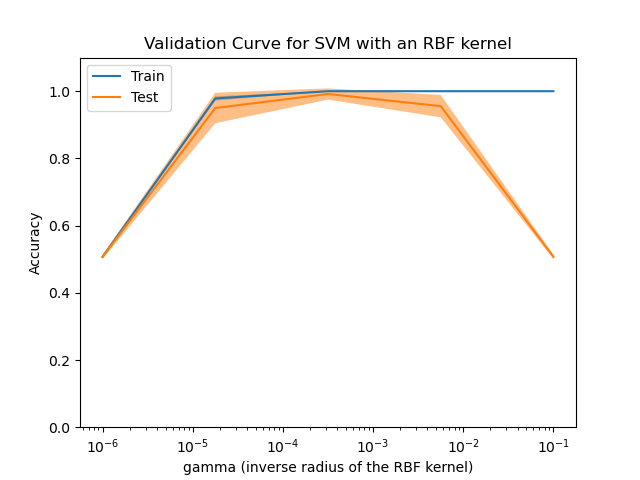
In this plot you can see the training scores and validation scores of an SVM for different values of the kernel parameter gamma. For very low values of gamma, you can see that both the training score and the validation score are low. This is called underfitting. Medium values of gamma will result in high values for both scores, i.e. the classifier is performing fairly well. If gamma is too high, the classifier will overfit, which means that the training score is good but the validation score is poor.
print(__doc__)

import matplotlib.pyplot as plt
import numpy as np

from sklearn.datasets import load_digits
from sklearn.svm import SVC
from sklearn.model_selection import validation_curve

digits = load_digits()
X, y = digits.data, digits.target

param_range = np.logspace(-6, -1, 5)
train_scores, test_scores = validation_curve(
    SVC(), X, y, param_name="gamma", param_range=param_range,
    cv=10, scoring="accuracy", n_jobs=1)
train_scores_mean = np.mean(train_scores, axis=1)
train_scores_std = np.std(train_scores, axis=1)
test_scores_mean = np.mean(test_scores, axis=1)
test_scores_std = np.std(test_scores, axis=1)

plt.title("Validation Curve with SVM")
plt.xlabel("$\gamma$")
plt.ylabel("Score")
plt.ylim(0.0, 1.1)
lw = 2
plt.semilogx(param_range, train_scores_mean, label="Training score",
             color="darkorange", lw=lw)
plt.fill_between(param_range, train_scores_mean - train_scores_std,
                 train_scores_mean + train_scores_std, alpha=0.2,
                 color="darkorange", lw=lw)
plt.semilogx(param_range, test_scores_mean, label="Cross-validation score",
             color="navy", lw=lw)
plt.fill_between(param_range, test_scores_mean - test_scores_std,
                 test_scores_mean + test_scores_std, alpha=0.2,
                 color="navy", lw=lw)
plt.legend(loc="best")
plt.show()
Total running time of the script: (0 minutes 33.714 seconds)
Download Python source code:
plot_validation_curve.py
Download IPython notebook:
plot_validation_curve.ipynb
© 2007–2016 The scikit-learn developers
Licensed under the 3-clause BSD License.
http://scikit-learn.org/stable/auto_examples/model_selection/plot_validation_curve.html


