
Example: Faces dataset decompositions
Faces dataset decompositions
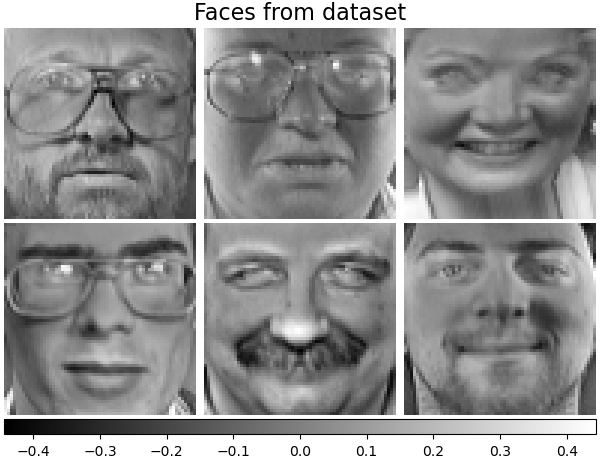
This example applies to The Olivetti faces dataset different unsupervised matrix decomposition (dimension reduction) methods from the module sklearn.decomposition (see the documentation chapter Decomposing signals in components (matrix factorization problems)) .
print(__doc__)

# Authors: Vlad Niculae, Alexandre Gramfort
# License: BSD 3 clause

import logging
from time import time

from numpy.random import RandomState
import matplotlib.pyplot as plt

from sklearn.datasets import fetch_olivetti_faces
from sklearn.cluster import MiniBatchKMeans
from sklearn import decomposition

# Display progress logs on stdout
logging.basicConfig(level=logging.INFO,
                    format='%(asctime)s %(levelname)s %(message)s')
n_row, n_col = 2, 3
n_components = n_row * n_col
image_shape = (64, 64)
rng = RandomState(0)
Load faces data
dataset = fetch_olivetti_faces(shuffle=True, random_state=rng)
faces = dataset.data

n_samples, n_features = faces.shape

# global centering
faces_centered = faces - faces.mean(axis=0)

# local centering
faces_centered -= faces_centered.mean(axis=1).reshape(n_samples, -1)

print("Dataset consists of %d faces" % n_samples)
Out:
Dataset consists of 400 faces
def plot_gallery(title, images, n_col=n_col, n_row=n_row):
    plt.figure(figsize=(2. * n_col, 2.26 * n_row))
    plt.suptitle(title, size=16)
    for i, comp in enumerate(images):
        plt.subplot(n_row, n_col, i + 1)
        vmax = max(comp.max(), -comp.min())
        plt.imshow(comp.reshape(image_shape), cmap=plt.cm.gray,
                   interpolation='nearest',
                   vmin=-vmax, vmax=vmax)
        plt.xticks(())
        plt.yticks(())
    plt.subplots_adjust(0.01, 0.05, 0.99, 0.93, 0.04, 0.)
List of the different estimators, whether to center and transpose the problem, and whether the transformer uses the clustering API.
estimators = [
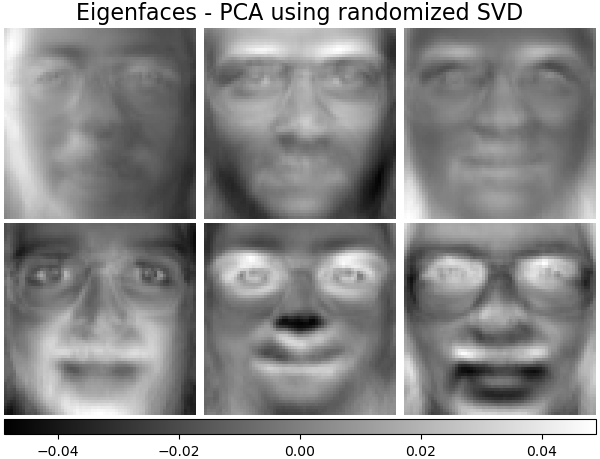
('Eigenfaces - PCA using randomized SVD',
decomposition.PCA(n_components=n_components, svd_solver='randomized',
whiten=True),
True),
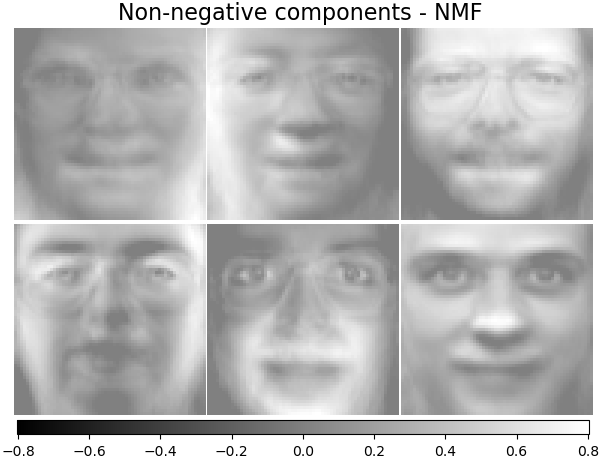
('Non-negative components - NMF',
decomposition.NMF(n_components=n_components, init='nndsvda', tol=5e-3),
False),
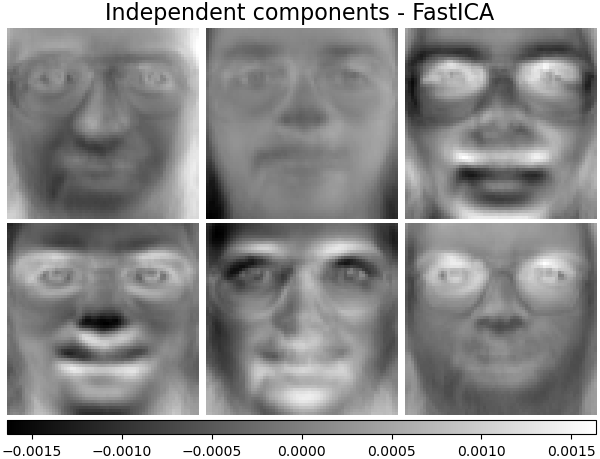
('Independent components - FastICA',
decomposition.FastICA(n_components=n_components, whiten=True),
True),
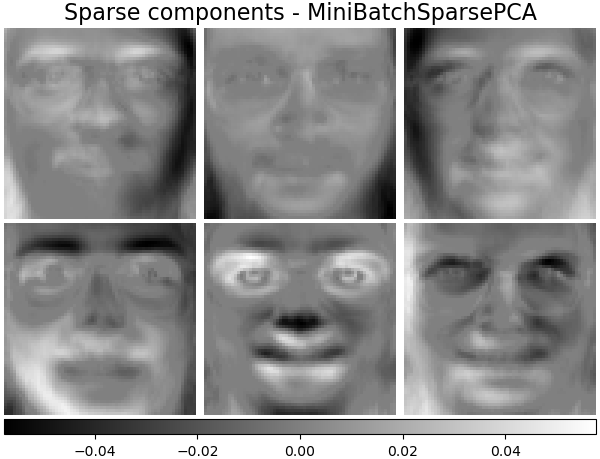
('Sparse comp. - MiniBatchSparsePCA',
decomposition.MiniBatchSparsePCA(n_components=n_components, alpha=0.8,
n_iter=100, batch_size=3,
random_state=rng),
True),
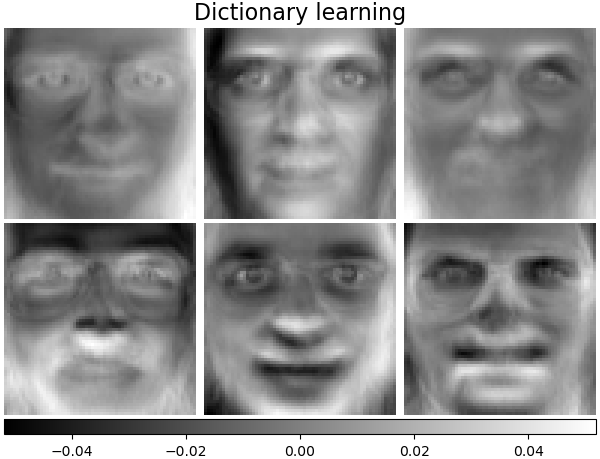
('MiniBatchDictionaryLearning',
decomposition.MiniBatchDictionaryLearning(n_components=15, alpha=0.1,
n_iter=50, batch_size=3,
random_state=rng),
True),
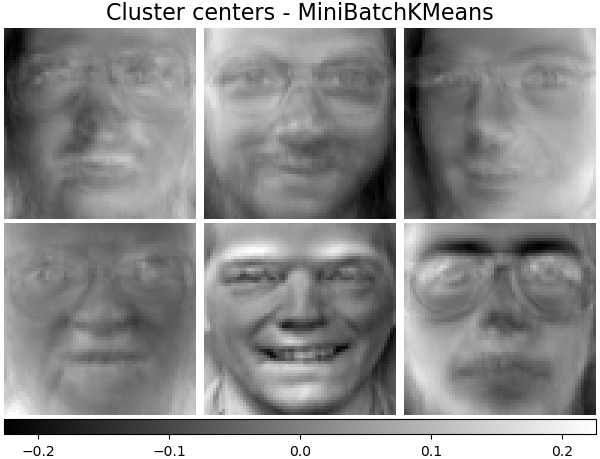
('Cluster centers - MiniBatchKMeans',
MiniBatchKMeans(n_clusters=n_components, tol=1e-3, batch_size=20,
max_iter=50, random_state=rng),
True),
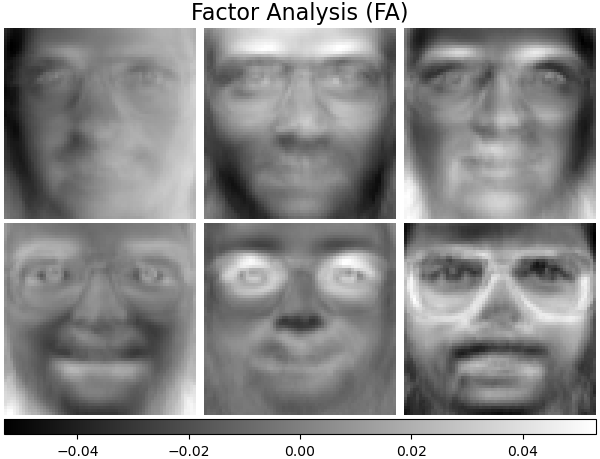
('Factor Analysis components - FA',
decomposition.FactorAnalysis(n_components=n_components, max_iter=2),
True),
]
Plot a sample of the input data
plot_gallery("First centered Olivetti faces", faces_centered[:n_components])
Do the estimation and plot it
for name, estimator, center in estimators:
print("Extracting the top %d %s..." % (n_components, name))
t0 = time()
data = faces
if center:
data = faces_centered
estimator.fit(data)
train_time = (time() - t0)
print("done in %0.3fs" % train_time)
if hasattr(estimator, 'cluster_centers_'):
components_ = estimator.cluster_centers_
else:
components_ = estimator.components_
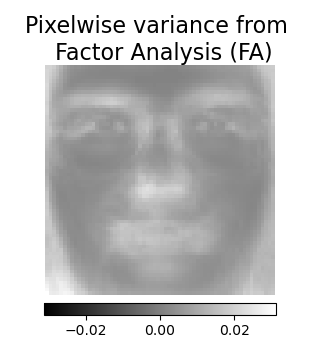
if (hasattr(estimator, 'noise_variance_') and
estimator.noise_variance_.shape != ()):
plot_gallery("Pixelwise variance",
estimator.noise_variance_.reshape(1, -1), n_col=1,
n_row=1)
plot_gallery('%s - Train time %.1fs' % (name, train_time),
components_[:n_components])
plt.show()
Out:
  Extracting the top 6 Eigenfaces - PCA using randomized SVD...
done in 0.125s
Extracting the top 6 Non-negative components - NMF...
done in 0.539s
Extracting the top 6 Independent components - FastICA...
done in 0.240s
Extracting the top 6 Sparse comp. - MiniBatchSparsePCA...
done in 1.172s
Extracting the top 6 MiniBatchDictionaryLearning...
done in 0.955s
Extracting the top 6 Cluster centers - MiniBatchKMeans...
done in 0.094s
Extracting the top 6 Factor Analysis components - FA...
done in 0.121s
Total running time of the script: (0 minutes 6.542 seconds)
Download Python source code:
plot_faces_decomposition.py
Download IPython notebook:
plot_faces_decomposition.ipynb
© 2007–2016 The scikit-learn developers
Licensed under the 3-clause BSD License.
http://scikit-learn.org/stable/auto_examples/decomposition/plot_faces_decomposition.html


