
Example: Model Complexity Influence
Model Complexity Influence
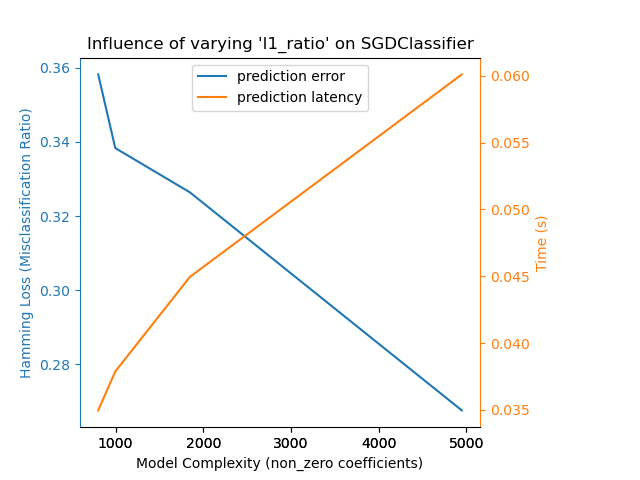
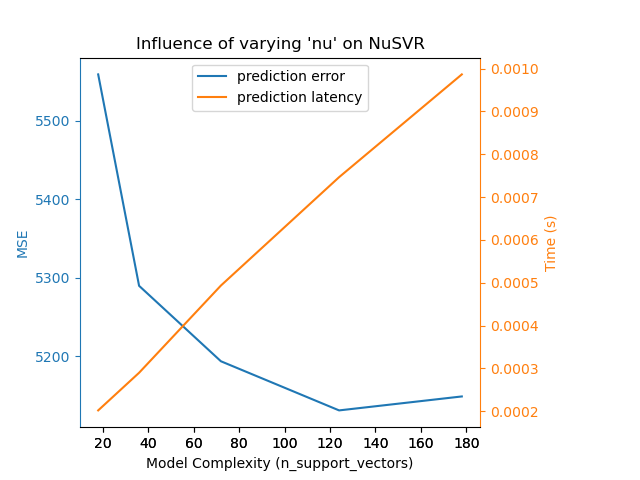
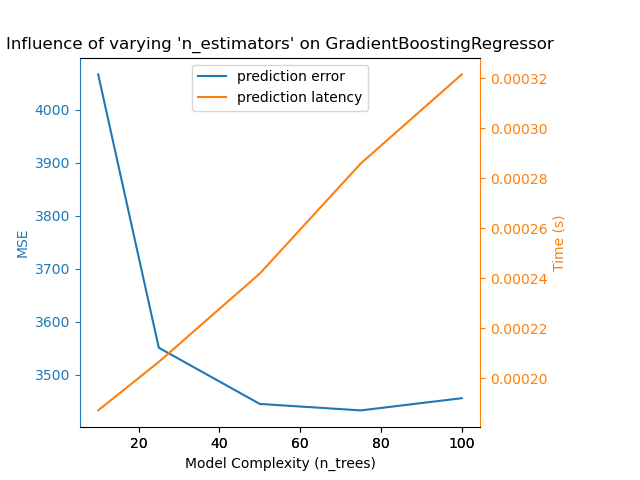
Demonstrate how model complexity influences both prediction accuracy and computational performance.
The dataset is the Boston Housing dataset (resp. 20 Newsgroups) for regression (resp. classification).
For each class of models we make the model complexity vary through the choice of relevant model parameters and measure the influence on both computational performance (latency) and predictive power (MSE or Hamming Loss).
print(__doc__)

# Author: Eustache Diemert <eustache@diemert.fr>
# License: BSD 3 clause

import time
import numpy as np
import matplotlib.pyplot as plt
from mpl_toolkits.axes_grid1.parasite_axes import host_subplot
from mpl_toolkits.axisartist.axislines import Axes
from scipy.sparse.csr import csr_matrix

from sklearn import datasets
from sklearn.utils import shuffle
from sklearn.metrics import mean_squared_error
from sklearn.svm.classes import NuSVR
from sklearn.ensemble.gradient_boosting import GradientBoostingRegressor
from sklearn.linear_model.stochastic_gradient import SGDClassifier
from sklearn.metrics import hamming_loss
Routines
# initialize random generator
np.random.seed(0)


def generate_data(case, sparse=False):
    """Generate regression/classification data."""
    bunch = None
    if case == 'regression':
        bunch = datasets.load_boston()
    elif case == 'classification':
        bunch = datasets.fetch_20newsgroups_vectorized(subset='all')
    X, y = shuffle(bunch.data, bunch.target)
    offset = int(X.shape[0] * 0.8)
    X_train, y_train = X[:offset], y[:offset]
    X_test, y_test = X[offset:], y[offset:]
    if sparse:
        X_train = csr_matrix(X_train)
        X_test = csr_matrix(X_test)
    else:
        X_train = np.array(X_train)
        X_test = np.array(X_test)
    y_test = np.array(y_test)
    y_train = np.array(y_train)
    data = {'X_train': X_train, 'X_test': X_test, 'y_train': y_train,
            'y_test': y_test}
    return data


def benchmark_influence(conf):
    """
    Benchmark influence of :changing_param: on both MSE and latency.
    """
    prediction_times = []
    prediction_powers = []
    complexities = []
    for param_value in conf['changing_param_values']:
        conf['tuned_params'][conf['changing_param']] = param_value
        estimator = conf['estimator'](**conf['tuned_params'])
        print("Benchmarking %s" % estimator)
        estimator.fit(conf['data']['X_train'], conf['data']['y_train'])
        conf['postfit_hook'](estimator)
        complexity = conf['complexity_computer'](estimator)
        complexities.append(complexity)
        start_time = time.time()
        for _ in range(conf['n_samples']):
            y_pred = estimator.predict(conf['data']['X_test'])
        elapsed_time = (time.time() - start_time) / float(conf['n_samples'])
        prediction_times.append(elapsed_time)
        pred_score = conf['prediction_performance_computer'](
            conf['data']['y_test'], y_pred)
        prediction_powers.append(pred_score)
        print("Complexity: %d | %s: %.4f | Pred. Time: %fs\n" % (
            complexity, conf['prediction_performance_label'], pred_score,
            elapsed_time))
    return prediction_powers, prediction_times, complexities


def plot_influence(conf, mse_values, prediction_times, complexities):
    """
    Plot influence of model complexity on both accuracy and latency.
    """
    plt.figure(figsize=(12, 6))
    host = host_subplot(111, axes_class=Axes)
    plt.subplots_adjust(right=0.75)
    par1 = host.twinx()
    host.set_xlabel('Model Complexity (%s)' % conf['complexity_label'])
    y1_label = conf['prediction_performance_label']
    y2_label = "Time (s)"
    host.set_ylabel(y1_label)
    par1.set_ylabel(y2_label)
    p1, = host.plot(complexities, mse_values, 'b-', label="prediction error")
    p2, = par1.plot(complexities, prediction_times, 'r-',
                    label="latency")
    host.legend(loc='upper right')
    host.axis["left"].label.set_color(p1.get_color())
    par1.axis["right"].label.set_color(p2.get_color())
    plt.title('Influence of Model Complexity - %s' % conf['estimator'].__name__)
    plt.show()


def _count_nonzero_coefficients(estimator):
    a = estimator.coef_.toarray()
    return np.count_nonzero(a)
main code
regression_data = generate_data('regression')
classification_data = generate_data('classification', sparse=True)
configurations = [
    {'estimator': SGDClassifier,
     'tuned_params': {'penalty': 'elasticnet', 'alpha': 0.001, 'loss':
                      'modified_huber', 'fit_intercept': True},
     'changing_param': 'l1_ratio',
     'changing_param_values': [0.25, 0.5, 0.75, 0.9],
     'complexity_label': 'non_zero coefficients',
     'complexity_computer': _count_nonzero_coefficients,
     'prediction_performance_computer': hamming_loss,
     'prediction_performance_label': 'Hamming Loss (Misclassification Ratio)',
     'postfit_hook': lambda x: x.sparsify(),
     'data': classification_data,
     'n_samples': 30},
    {'estimator': NuSVR,
     'tuned_params': {'C': 1e3, 'gamma': 2 ** -15},
     'changing_param': 'nu',
     'changing_param_values': [0.1, 0.25, 0.5, 0.75, 0.9],
     'complexity_label': 'n_support_vectors',
     'complexity_computer': lambda x: len(x.support_vectors_),
     'data': regression_data,
     'postfit_hook': lambda x: x,
     'prediction_performance_computer': mean_squared_error,
     'prediction_performance_label': 'MSE',
     'n_samples': 30},
    {'estimator': GradientBoostingRegressor,
     'tuned_params': {'loss': 'ls'},
     'changing_param': 'n_estimators',
     'changing_param_values': [10, 50, 100, 200, 500],
     'complexity_label': 'n_trees',
     'complexity_computer': lambda x: x.n_estimators,
     'data': regression_data,
     'postfit_hook': lambda x: x,
     'prediction_performance_computer': mean_squared_error,
     'prediction_performance_label': 'MSE',
     'n_samples': 30},
]
for conf in configurations:
    prediction_performances, prediction_times, complexities = \
        benchmark_influence(conf)
    plot_influence(conf, prediction_performances, prediction_times,
                   complexities)
Out:
  Benchmarking SGDClassifier(alpha=0.001, average=False, class_weight=None, epsilon=0.1,
       eta0=0.0, fit_intercept=True, l1_ratio=0.25,
       learning_rate='optimal', loss='modified_huber', n_iter=5, n_jobs=1,
       penalty='elasticnet', power_t=0.5, random_state=None, shuffle=True,
       verbose=0, warm_start=False)
Complexity: 4454 | Hamming Loss (Misclassification Ratio): 0.2501 | Pred. Time: 0.027734s

Benchmarking SGDClassifier(alpha=0.001, average=False, class_weight=None, epsilon=0.1,
       eta0=0.0, fit_intercept=True, l1_ratio=0.5, learning_rate='optimal',
       loss='modified_huber', n_iter=5, n_jobs=1, penalty='elasticnet',
       power_t=0.5, random_state=None, shuffle=True, verbose=0,
       warm_start=False)
Complexity: 1624 | Hamming Loss (Misclassification Ratio): 0.2923 | Pred. Time: 0.019370s

Benchmarking SGDClassifier(alpha=0.001, average=False, class_weight=None, epsilon=0.1,
       eta0=0.0, fit_intercept=True, l1_ratio=0.75,
       learning_rate='optimal', loss='modified_huber', n_iter=5, n_jobs=1,
       penalty='elasticnet', power_t=0.5, random_state=None, shuffle=True,
       verbose=0, warm_start=False)
Complexity: 873 | Hamming Loss (Misclassification Ratio): 0.3191 | Pred. Time: 0.015396s

Benchmarking SGDClassifier(alpha=0.001, average=False, class_weight=None, epsilon=0.1,
       eta0=0.0, fit_intercept=True, l1_ratio=0.9, learning_rate='optimal',
       loss='modified_huber', n_iter=5, n_jobs=1, penalty='elasticnet',
       power_t=0.5, random_state=None, shuffle=True, verbose=0,
       warm_start=False)
Complexity: 655 | Hamming Loss (Misclassification Ratio): 0.3252 | Pred. Time: 0.014888s

Benchmarking NuSVR(C=1000.0, cache_size=200, coef0=0.0, degree=3, gamma=3.0517578125e-05,
   kernel='rbf', max_iter=-1, nu=0.1, shrinking=True, tol=0.001,
   verbose=False)
Complexity: 69 | MSE: 31.8133 | Pred. Time: 0.000360s

Benchmarking NuSVR(C=1000.0, cache_size=200, coef0=0.0, degree=3, gamma=3.0517578125e-05,
   kernel='rbf', max_iter=-1, nu=0.25, shrinking=True, tol=0.001,
   verbose=False)
Complexity: 136 | MSE: 25.6140 | Pred. Time: 0.000645s

Benchmarking NuSVR(C=1000.0, cache_size=200, coef0=0.0, degree=3, gamma=3.0517578125e-05,
   kernel='rbf', max_iter=-1, nu=0.5, shrinking=True, tol=0.001,
   verbose=False)
Complexity: 243 | MSE: 22.3315 | Pred. Time: 0.001106s

Benchmarking NuSVR(C=1000.0, cache_size=200, coef0=0.0, degree=3, gamma=3.0517578125e-05,
   kernel='rbf', max_iter=-1, nu=0.75, shrinking=True, tol=0.001,
   verbose=False)
Complexity: 350 | MSE: 21.3679 | Pred. Time: 0.001699s

Benchmarking NuSVR(C=1000.0, cache_size=200, coef0=0.0, degree=3, gamma=3.0517578125e-05,
   kernel='rbf', max_iter=-1, nu=0.9, shrinking=True, tol=0.001,
   verbose=False)
Complexity: 404 | MSE: 21.0915 | Pred. Time: 0.001865s

Benchmarking GradientBoostingRegressor(alpha=0.9, criterion='friedman_mse', init=None,
             learning_rate=0.1, loss='ls', max_depth=3, max_features=None,
             max_leaf_nodes=None, min_impurity_split=1e-07,
             min_samples_leaf=1, min_samples_split=2,
             min_weight_fraction_leaf=0.0, n_estimators=10, presort='auto',
             random_state=None, subsample=1.0, verbose=0, warm_start=False)
Complexity: 10 | MSE: 28.9793 | Pred. Time: 0.000111s

Benchmarking GradientBoostingRegressor(alpha=0.9, criterion='friedman_mse', init=None,
             learning_rate=0.1, loss='ls', max_depth=3, max_features=None,
             max_leaf_nodes=None, min_impurity_split=1e-07,
             min_samples_leaf=1, min_samples_split=2,
             min_weight_fraction_leaf=0.0, n_estimators=50, presort='auto',
             random_state=None, subsample=1.0, verbose=0, warm_start=False)
Complexity: 50 | MSE: 8.3398 | Pred. Time: 0.000187s

Benchmarking GradientBoostingRegressor(alpha=0.9, criterion='friedman_mse', init=None,
             learning_rate=0.1, loss='ls', max_depth=3, max_features=None,
             max_leaf_nodes=None, min_impurity_split=1e-07,
             min_samples_leaf=1, min_samples_split=2,
             min_weight_fraction_leaf=0.0, n_estimators=100,
             presort='auto', random_state=None, subsample=1.0, verbose=0,
             warm_start=False)
Complexity: 100 | MSE: 7.0096 | Pred. Time: 0.000267s

Benchmarking GradientBoostingRegressor(alpha=0.9, criterion='friedman_mse', init=None,
             learning_rate=0.1, loss='ls', max_depth=3, max_features=None,
             max_leaf_nodes=None, min_impurity_split=1e-07,
             min_samples_leaf=1, min_samples_split=2,
             min_weight_fraction_leaf=0.0, n_estimators=200,
             presort='auto', random_state=None, subsample=1.0, verbose=0,
             warm_start=False)
Complexity: 200 | MSE: 6.1836 | Pred. Time: 0.000420s

Benchmarking GradientBoostingRegressor(alpha=0.9, criterion='friedman_mse', init=None,
             learning_rate=0.1, loss='ls', max_depth=3, max_features=None,
             max_leaf_nodes=None, min_impurity_split=1e-07,
             min_samples_leaf=1, min_samples_split=2,
             min_weight_fraction_leaf=0.0, n_estimators=500,
             presort='auto', random_state=None, subsample=1.0, verbose=0,
             warm_start=False)
Complexity: 500 | MSE: 6.3426 | Pred. Time: 0.000911s
Total running time of the script: (0 minutes 25.008 seconds)
Download Python source code:
plot_model_complexity_influence.py
Download IPython notebook:
plot_model_complexity_influence.ipynb
© 2007–2016 The scikit-learn developers
Licensed under the 3-clause BSD License.
http://scikit-learn.org/stable/auto_examples/applications/plot_model_complexity_influence.html


