
axes.Axes.matshow
matplotlib.axes.Axes.matshow
-
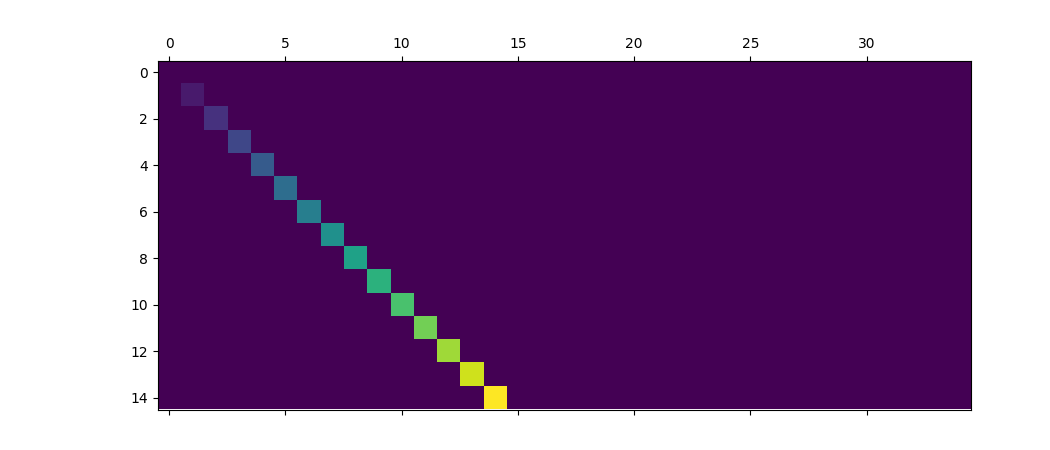
Axes.matshow(Z, **kwargs) -
Plot a matrix or array as an image.
The matrix will be shown the way it would be printed, with the first row at the top. Row and column numbering is zero-based.
Parameters: Z : array_like shape (n, m)
The matrix to be displayed.
Returns: image :
AxesImageOther Parameters: kwargs :
imshowargumentsSets
originto ‘upper’, ‘interpolation’ to ‘nearest’ and ‘aspect’ to equal.See also
-
imshow - plot an image
Examples
(Source code, png, pdf)
-
© 2012–2017 Matplotlib Development Team. All rights reserved.
Licensed under the Matplotlib License Agreement.
http://matplotlib.org/2.0.2/api/_as_gen/matplotlib.axes.Axes.matshow.html


