
axes.Axes.bar
matplotlib.axes.Axes.bar
-
Axes.bar(left, height, width=0.8, bottom=None, **kwargs) -
Make a bar plot.
Make a bar plot with rectangles bounded by:
-
left, left + width, bottom, bottom + height - (left, right, bottom and top edges)
Parameters: left : sequence of scalars
the x coordinates of the left sides of the bars
height : sequence of scalars
the heights of the bars
width : scalar or array-like, optional
the width(s) of the bars default: 0.8
bottom : scalar or array-like, optional
the y coordinate(s) of the bars default: None
color : scalar or array-like, optional
the colors of the bar faces
edgecolor : scalar or array-like, optional
the colors of the bar edges
linewidth : scalar or array-like, optional
width of bar edge(s). If None, use default linewidth; If 0, don’t draw edges. default: None
tick_label : string or array-like, optional
the tick labels of the bars default: None
xerr : scalar or array-like, optional
if not None, will be used to generate errorbar(s) on the bar chart default: None
yerr : scalar or array-like, optional
if not None, will be used to generate errorbar(s) on the bar chart default: None
ecolor : scalar or array-like, optional
specifies the color of errorbar(s) default: None
capsize : scalar, optional
determines the length in points of the error bar caps default: None, which will take the value from the
errorbar.capsizercParam.error_kw : dict, optional
dictionary of kwargs to be passed to errorbar method. ecolor and capsize may be specified here rather than as independent kwargs.
align : {‘center’, ‘edge’}, optional
If ‘edge’, aligns bars by their left edges (for vertical bars) and by their bottom edges (for horizontal bars). If ‘center’, interpret the
leftargument as the coordinates of the centers of the bars. To align on the align bars on the right edge pass a negativewidth.orientation : {‘vertical’, ‘horizontal’}, optional
The orientation of the bars.
log : boolean, optional
If true, sets the axis to be log scale. default: False
Returns: bars : matplotlib.container.BarContainer
Container with all of the bars + errorbars
See also
-
barh - Plot a horizontal bar plot.
Notes
The optional arguments
color,edgecolor,linewidth,xerr, andyerrcan be either scalars or sequences of length equal to the number of bars. This enables you to use bar as the basis for stacked bar charts, or candlestick plots. Detail:xerrandyerrare passed directly toerrorbar(), so they can also have shape 2xN for independent specification of lower and upper errors.Other optional kwargs:
Property Description agg_filterunknown alphafloat or None animated[True | False] antialiasedor aa[True | False] or None for default axesan Axesinstancecapstyle[‘butt’ | ‘round’ | ‘projecting’] clip_boxa matplotlib.transforms.Bboxinstanceclip_on[True | False] clip_path[ ( Path,Transform) |Patch| None ]colormatplotlib color spec containsa callable function edgecoloror ecmpl color spec, None, ‘none’, or ‘auto’ facecoloror fcmpl color spec, or None for default, or ‘none’ for no color figurea matplotlib.figure.Figureinstancefill[True | False] gidan id string hatch[‘/’ | ‘\’ | ‘|’ | ‘-‘ | ‘+’ | ‘x’ | ‘o’ | ‘O’ | ‘.’ | ‘*’] joinstyle[‘miter’ | ‘round’ | ‘bevel’] labelstring or anything printable with ‘%s’ conversion. linestyleor ls[‘solid’ | ‘dashed’, ‘dashdot’, ‘dotted’ | (offset, on-off-dash-seq) | '-'|'--'|'-.'|':'|'None'|' '|'']linewidthor lwfloat or None for default path_effectsunknown picker[None|float|boolean|callable] rasterized[True | False | None] sketch_paramsunknown snapunknown transformTransforminstanceurla url string visible[True | False] zorderany number Examples
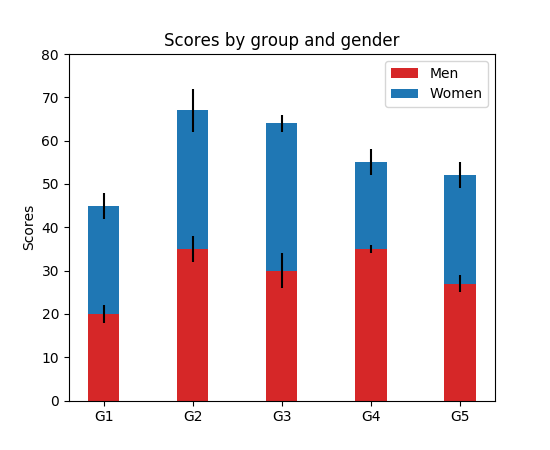
Example: A stacked bar chart.
(Source code, png, pdf)
Note
In addition to the above described arguments, this function can take a data keyword argument. If such a data argument is given, the following arguments are replaced by data[<arg>]:
- All arguments with the following names: ‘bottom’, ‘color’, ‘ecolor’, ‘edgecolor’, ‘height’, ‘left’, ‘linewidth’, ‘tick_label’, ‘width’, ‘xerr’, ‘yerr’.
-
© 2012–2017 Matplotlib Development Team. All rights reserved.
Licensed under the Matplotlib License Agreement.
http://matplotlib.org/2.0.2/api/_as_gen/matplotlib.axes.Axes.bar.html


