
TensorFlow Debugger Command-Line-Interface Tutorial: MNIST
TensorFlow Debugger (tfdbg) Command-Line-Interface Tutorial: MNIST
(Experimental)
TensorFlow debugger (tfdbg) is a specialized debugger for TensorFlow. It provides visibility into the internal structure and states of running TensorFlow graphs. The insight gained from this visibility should facilitate debugging of various types of model bugs during training and inference.
This tutorial showcases the features of tfdbg command-line interface (CLI), by focusing on how to debug a type of frequently-encountered bug in TensorFlow model development: bad numerical values (nans and infs) causing training to fail.
To observe such an issue, run the following code without the debugger:
python -m tensorflow.python.debug.examples.debug_mnist
This code trains a simple NN for MNIST digit image recognition. Notice that the accuracy increases slightly after the first training step, but then gets stuck at a low (near-chance) level:

Scratching your head, you suspect that certain nodes in the training graph generated bad numeric values such as infs and nans. The computation-graph paradigm of TensorFlow makes it non-trivial to debug such model-internal states with general-purpose debuggers such as Python's pdb. tfdbg specializes in diagnosing these types of issues and pinpointing the exact node where the problem first surfaced.
Wrapping TensorFlow Sessions with tfdbg
To add support for tfdbg in our example, we just need to add the following three lines of code, which wrap the Session object with a debugger wrapper when the --debug flag is provided:
# Let your BUILD target depend on "//tensorflow/python/debug:debug_py"
# (You don't need to worry about the BUILD dependency if you are using a pip
#  install of open-source TensorFlow.)
from tensorflow.python import debug as tf_debug

sess = tf_debug.LocalCLIDebugWrapperSession(sess)
sess.add_tensor_filter("has_inf_or_nan", tf_debug.has_inf_or_nan)
This wrapper has the same interface as Session, so enabling debugging requires no other changes to the code. But the wrapper provides additional features including:
- Bringing up a terminal-based user interface (UI) before and after each
run()call, to let you control the execution and inspect the graph's internal state. - Allowing you to register special "filters" for tensor values, to facilitate the diagnosis of issues.
In this example, we are registering a tensor filter called tfdbg.has_inf_or_nan, which simply determines if there are any nan or inf values in any intermediate tensor of the graph. (This filter is a common enough use case that we ship it with the debug_data module.)
def has_inf_or_nan(datum, tensor):
  return np.any(np.isnan(tensor)) or np.any(np.isinf(tensor))
TIP: You can also write your own custom filters. See the API documentation of DebugDumpDir.find() for additional information.
Debugging Model Training with tfdbg
Let's try training the model again with debugging enabled. Execute the command from above, this time with the --debug flag added:
python -m tensorflow.python.debug.examples.debug_mnist --debug
The debug wrapper session will prompt you when it is about to execute the first run() call, with information regarding the fetched tensor and feed dictionaries displayed on the screen.
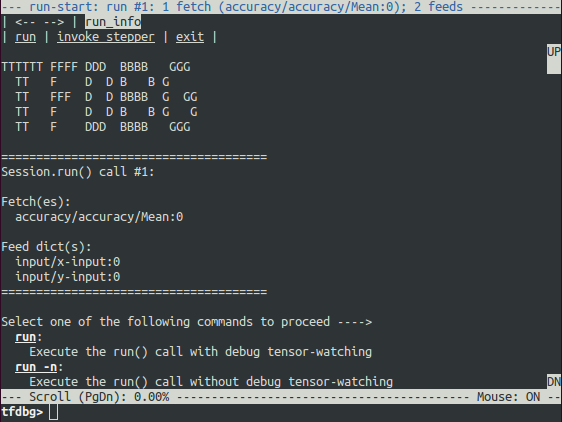
This is what we refer to as the run-start UI. If the screen size is too small to display the content of the message in its entirety, you can resize it or use the PageUp / PageDown / Home / End keys to navigate the screen output.
As the screen output indicates, the first run() call calculates the accuracy using a test data set—i.e., a forward pass on the graph. You can enter the command run (or its shorthand r) to launch the run() call. On terminals that support mouse events, you can simply click the underlined run on the top left corner of the screen to proceed.
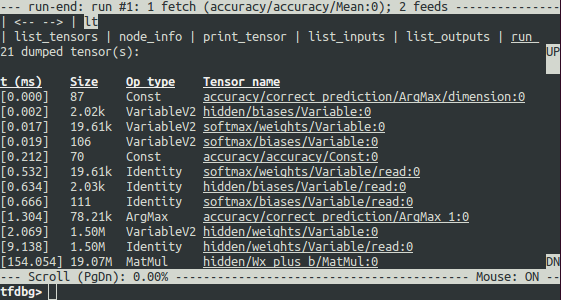
This will bring up another screen right after the run() call has ended, which will display all dumped intermediate tensors from the run. (These tensors can also be obtained by running the command lt after you executed run.) This is called the run-end UI:
tfdbg CLI Frequently-Used Commands
Try the following commands at the tfdbg> prompt (referencing the code at tensorflow/python/debug/examples/debug_mnist.py):
| Command Example | Explanation |
|---|---|
pt hidden/Relu:0 | Print the value of the tensor hidden/Relu:0. |
pt hidden/Relu:0[0:50,:] | Print a subarray of the tensor hidden/Relu:0, using numpy-style array slicing. |
pt hidden/Relu:0[0:50,:] -a | For a large tensor like the one here, print its value in its entirety—i.e., without using any ellipsis. May take a long time for large tensors. |
pt hidden/Relu:0[0:10,:] -a -r [1,inf] | Use the -r flag to highlight elements falling into the specified numerical range. Multiple ranges can be used in conjunction, e.g., -r [[-inf,-1],[1,inf]]. |
@[10,0] or @10,0
| Navigate to indices [10, 0] in the tensor being displayed. |
/inf | Search the screen output with the regex inf and highlight any matches. |
/ | Scroll to the next line with matches to the searched regex (if any). |
ni -a hidden/Relu | Display information about the node hidden/Relu, including node attributes. |
ni -t hidden/Relu | Display the stack trace of node hidden/Relu's construction. |
li -r hidden/Relu:0 | List the inputs to the node hidden/Relu, recursively—i.e., the input tree. |
lo -r hidden/Relu:0 | List the recipients of the output of the node hidden/Relu, recursively—i.e., the output recipient tree. |
lt -n softmax.* | List all dumped tensors whose names match the regular-expression pattern softmax.*. |
lt -t MatMul | List all dumped tensors whose node type is MatMul. |
ls | List all Python source files responsible for constructing the nodes (and tensors) in the current graph. |
ls -n softmax.* | List Python source files responsible for constructing the nodes whose names match the pattern softmax.*. |
ps /path/to/source.py | Print the Python source file source.py, with the lines annotated with the ops created at each of them, respectively. |
ps -t /path/to/source.py | Same as the command above, but perform annotation using dumped Tensors, instead of ops. |
ps -b 30 /path/to/source.py | Annotate source.py beginning at line 30. |
run_info or ri
| Display information about the current run, including fetches and feeds. |
help | Print general help information listing all available tfdbg commands and their flags. |
help lt | Print the help information for the lt command. |
In this first run() call, there happen to be no problematic numerical values. You can move on to the next run by using the command run or its shorthand r.
TIP: If you enter
runorrrepeatedly, you will be able to move through therun()calls in a sequential manner.You can also use the
-tflag to move ahead a number ofrun()calls at a time, for example:tfdbg> run -t 10
Instead of entering run repeatedly and manually searching for nans and infs in the run-end UI after every run() call, you can use the following command to let the debugger repeatedly execute run() calls without stopping at the run-start or run-end prompt, until the first nan or inf value shows up in the graph. This is analogous to conditional breakpoints in some procedural-language debuggers:
tfdbg> run -f has_inf_or_nan
NOTE: This works because we have previously registered a filter for
nans andinfs calledhas_inf_or_nan(as explained previously). If you have registered any other filters, you can let tfdbg run till any tensors pass that filter as well, e.g.,# In python code: sess.add_tensor_filter('my_filter', my_filter_callable) # Run at tfdbg run-start prompt: tfdbg> run -f my_filter
After you enter run -f has_inf_or_nan, you will see the following screen with a red-colored title line indicating tfdbg stopped immediately after a run() call generated intermediate tensors that passed the specified filter has_inf_or_nan:
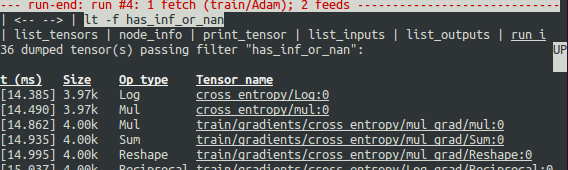
As the screen display indicates, the has_inf_or_nan filter is first passed during the fourth run() call: an Adam optimizer forward-backward training pass on the graph. In this run, 36 (out of the total 95) intermediate tensors contain nan or inf values. These tensors are listed in chronological order, with their timestamps displayed on the left. At the top of the list, you can see the first tensor in which the bad numerical values first surfaced: cross_entropy/Log:0.
To view the value of the tensor, click the underlined tensor name cross_entropy/Log:0 or enter the equivalent command:
tfdbg> pt cross_entropy/Log:0
Scroll down a little and you will notice some scattered inf values. If the instances of inf and nan are difficult to spot by eye, you can use the following command to perform a regex search and highlight the output:
tfdbg> /inf
Or, alternatively:
tfdbg> /(inf|nan)
Why did these infinities appear? To further debug, display more information about the node cross_entropy/Log by clicking the underlined node_info menu item on the top or entering the equivalent command:
tfdbg> ni cross_entropy/Log
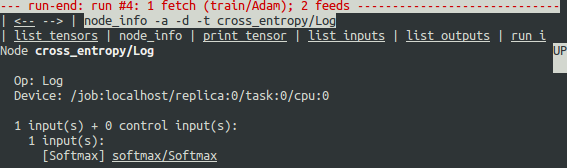
You can see that this node has the op type Log and that its input is the node softmax/Softmax. Run the following command to take a closer look at the input tensor:
tfdbg> pt softmax/Softmax:0
Examine the values in the input tensor, and search to see if there are any zeros:
tfdbg> /0\.000
Indeed, there are zeros. Now it is clear that the origin of the bad numerical values is the node cross_entropy/Log taking logs of zeros. To find out the culprit line in the Python source code, use the -t flag of the ni command to show the traceback of the node's construction:
tfdbg> ni -t cross_entropy/Log
The -t flag is used by default, if you use the clickable "node_info" menu item at the top of the screen.
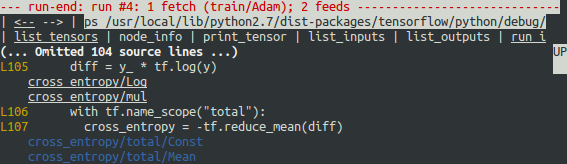
From the traceback, you can see that the op is constructed around lines 105-106 of debug_mnist.py:
diff = y_ * tf.log(y)
*tfdbg has a feature that makes it ease to trace Tensors and ops back to lines in Python source files. It can annotate lines of a Python file with the ops or Tensors created by them. To use this feature, simply click the underlined line numbers in the stack trace output of the ni -t <op_name> commands, or use the ps (or print_source) command such as: ps /path/to/source.py. See the screenshot below for an example of ps output:
Apply a value clipping on the input to tf.log to resolve this problem:
diff = y_ * tf.log(tf.clip_by_value(y, 1e-8, 1.0))
Now, try training again with --debug:
python -m tensorflow.python.debug.examples.debug_mnist --debug
Enter run -f has_inf_or_nan at the tfdbg> prompt and confirm that no tensors are flagged as containing nan or inf values, and accuracy no longer gets stuck. Success!
Debugging tf-learn Estimators
For documentation on tfdbg to debug tf.contrib.learn Estimators and Experiments, please see How to Use TensorFlow Debugger (tfdbg) with tf.contrib.learn.
Offline Debugging of Remotely-Running Sessions
Oftentimes, your model is running in a remote machine or process that you don't have terminal access to. To perform model debugging in such cases, you can use the offline_analyzer of tfdbg. It operates on dumped data directories. If the process you are running is written in Python, you can configure the RunOptions proto that you call your Session.run() method with, by using the method tfdbg.watch_graph. This will cause the intermediate tensors and runtime graphs to be dumped to a shared storage location of your choice when the Session.run() call occurs. For example:
from tensorflow.python.debug import debug_utils

# ... Code where your session and graph are set up...

run_options = tf.RunOptions()
debug_utils.watch_graph(
      run_options,
      session.graph,
      debug_urls=["file:///shared/storage/location/tfdbg_dumps_1"])
# Be sure to use different directories for different run() calls.

session.run(fetches, feed_dict=feeds, options=run_options)
Later, in an environment that you have terminal access to, you can load and inspect the data in the dump directory on the shared storage by using the offline_analyzer of tfdbg. For example:
python -m tensorflow.python.debug.cli.offline_analyzer \
    --dump_dir=/shared/storage/location/tfdbg_dumps_1
The Session wrapper DumpingDebugWrapperSession offers an easier and more flexible way to generate dumps on filesystem that can be analyzed offline. To use it, simply do:
# Let your BUILD target depend on "//tensorflow/python/debug:debug_py
# (You don't need to worry about the BUILD dependency if you are using a pip
#  install of open-source TensorFlow.)
from tensorflow.python.debug import debug_utils

sess = tf_debug.DumpingDebugWrapperSession(
    sess, "/shared/storage/location/tfdbg_dumps_1/", watch_fn=my_watch_fn)
watch_fn=my_watch_fn is a Callable that allows you to configure what Tensors to watch on different Session.run() calls, as a function of the fetches and feed_dict to the run() call and other states. See the API doc of DumpingDebugWrapperSession for more details.
If you model code is written in C++ or other languages, you can also modify the debug_options field of RunOptions to generate debug dumps that can be inspected offline. See the proto definition for more details.
Other Features of the tfdbg CLI
- Navigation through command history using the Up and Down arrow keys. Prefix-based navigation is also supported.
- Navigation through history of screen outputs using the
prevandnextcommands or by clicking the underlined<--and-->links near the top of the screen. - Tab completion of commands and some command arguments.
- Write screen output to file by using bash-style redirection. For example:
tfdbg> pt cross_entropy/Log:0[:, 0:10] > /tmp/xent_value_slices.txt
Frequently Asked Questions
Q: Do the timestamps on the left side of the lt output reflect actual performance in a non-debugging session?
A: No. The debugger inserts additional special-purpose debug nodes to the graph to record the values of intermediate tensors. These nodes certainly slow down the graph execution. If you are interested in profiling your model, check out tfprof and other profiling tools for TensorFlow.
Q: How do I link tfdbg against my Session in Bazel? Why do I see an error such as "ImportError: cannot import name debug"?
A: In your BUILD rule, declare dependencies: "//tensorflow:tensorflow_py" and "//tensorflow/python/debug:debug_py". The first is the dependency that you include to use TensorFlow even without debugger support; the second enables the debugger. Then, In your Python file, add:
from tensorflow.python import debug as tf_debug

# Then wrap your TensorFlow Session with the local-CLI wrapper.
sess = tf_debug.LocalCLIDebugWrapperSession(sess)
Q: Does tfdbg help debugging runtime errors such as shape mismatches?
A: Yes. tfdbg intercepts errors generated by ops during runtime and presents the errors with some debug instructions to the user in the CLI. See examples:
# Debugging shape mismatch during matrix multiplication.
python -m tensorflow.python.debug.examples.debug_errors \
    --error shape_mismatch --debug

# Debugging uninitialized variable.
python -m tensorflow.python.debug.examples.debug_errors \
    --error uninitialized_variable --debug
Q: How can I let my tfdbg-wrapped Sessions or Hooks run the debug mode only from the main thread?
A: This is a common use case, in which the Session object is used from multiple threads concurrently. Typically, the child threads take care of background tasks such as running enqueue operations. Oftentimes, you want to debug only the main thread (or less frequently, only one of the child threads). You can use the thread_name_filter keyword argument of LocalCLIDebugWrapperSession to achieve this type of thread-selective debugging. For example, if you would like to debug from only the main thread, you can do:
sess = tf_debug.LocalCLIDebugWrapperSession(sess, thread_name_filter="MainThread$")
The above example relies on the fact that main threads in Python have the default name MainThread.
Q: The model I am debugging is very large. The data dumped by tfdbg fills up the free space of my disk. What can I do?
A: For large models, i.e., models with many intermediate tensors, large sizes in individual intermediate tensors and/or many iterations in any tf.while_loops that the graph contains, this kind of disk space issue can happen.
There are three possible workarounds or solutions:
- The constructors of
LocalCLIDebugWrapperSessionandLocalCLIDebugHookprovide a keyword argument,dump_root, with which you can specify the path to which tfdbg dumps the debug data. For example:
``` python # For LocalCLIDebugWrapperSession sess = tf_debug.LocalCLIDebugWrapperSession(dump_root="/with/lots/of/space")
# For LocalCLIDebugHook hooks = [tf_debug.LocalCLIDebugHook(dump_root="/with/lots/of/space")] `` Make sure that the directory pointed to by dump_root is empty or nonexistent. **tfdbg** cleans up the dump directories before exiting. 2. Reduce the batch size used during the runs. 3. Use the filtering options of **tfdbg**'srun` command to watch only specific nodes in the graph. For example:
tfdbg> run --node_name_filter .*hidden.* tfdbg> run --op_type_filter Variable.* tfdbg> run --tensor_dtype_filter int.*
Q: Why can't I select text in the tfdbg CLI?
A: This is because the tfdbg CLI enables mouse events in the terminal by default. This mouse-mask mode overrides default terminal interactions, including text selection. You can re-enable text selection by using the command mouse off or m off.
Q: What are the platform-specific system requirements of tfdbg CLI in open-source TensorFlow?
A: On Mac OS X, the ncurses library is required. It can be installed with brew install homebrew/dupes/ncurses. On Windows, the pyreadline library is required. If you are using Anaconda3, you can install it with a command such as "C:\Program Files\Anaconda3\Scripts\pip.exe" install pyreadline.
© 2017 The TensorFlow Authors. All rights reserved.
Licensed under the Creative Commons Attribution License 3.0.
Code samples licensed under the Apache 2.0 License.
https://www.tensorflow.org/programmers_guide/debugger


