 免费 AI IDE
在之前的文章中小编介绍过subplot可以画子图。但是matplotlib绘制子图的方式不止一种,subplots也可以画子图。因为subplots介绍比较少,小编打算进行一个对比,各位小伙伴可以看看这两个方法是否功能一致。
对比开始:
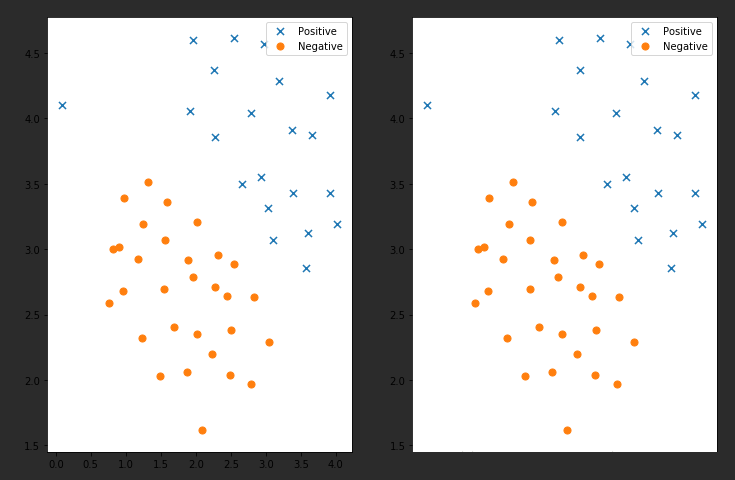
需求:画出两张子图,在一行显示,子图中的内容一模一样
subplot代码:
ax1 = plt.subplot(1,2,1)
ax1.scatter(positive['X1'], positive['X2'], s=50, marker='x', label='Positive')
ax1.scatter(negative['X1'], negative['X2'], s=50, marker='o', label='Negative')
ax1.legend()#添加图列就是右上角的点说明
ax2 = plt.subplot(1,2,2)
ax2.scatter(positive['X1'], positive['X2'], s=50, marker='x', label='Positive')
ax2.scatter(negative['X1'], negative['X2'], s=50, marker='o', label='Negative')
ax2.legend()#添加图列就是右上角的点说明
subplots代码:
fig, ax = plt.subplots(figsize=(12,8),ncols=2,nrows=1)#该方法会返回画图对象和坐标对象ax,figsize是设置子图长宽(1200,800)
ax[0].scatter(positive['X1'], positive['X2'], s=50, marker='x', label='Positive')
ax[0].scatter(negative['X1'], negative['X2'], s=50, marker='o', label='Negative')
ax[0].legend()#添加图列就是右上角的点说明
ax[1].scatter(positive['X1'], positive['X2'], s=50, marker='x', label='Positive')
ax[1].scatter(negative['X1'], negative['X2'], s=50, marker='o', label='Negative')
ax[1].legend()#添加图列就是右上角的点说明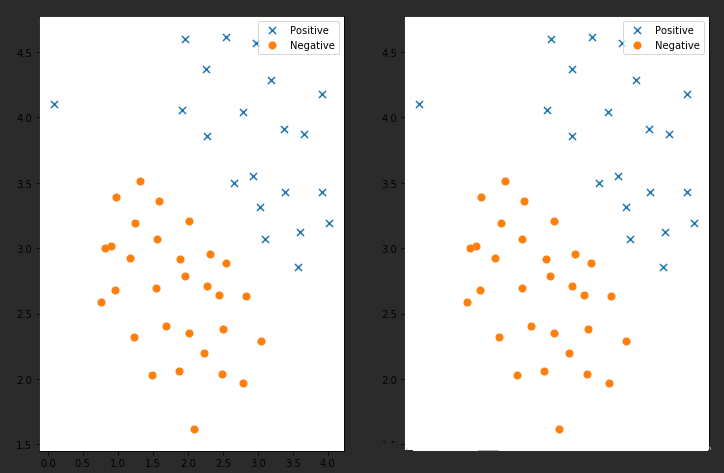
对比结果:
可以看出来两者都可以实现画子图功能,只不过subplots帮我们把画板规划好了,返回一个坐标数组对象,而subplot每次只能返回一个坐标对象,subplots可以直接指定画板的大小。
到此subplot和subplots区别在哪相信小伙伴心里已经清楚了,更多Matplotlib 使用介绍的文章可以继续关注W3Cschool后续的内容。